
City traffic congestion analysis
The macroscopic fundamental diagram (MFD) is a traffic analysis tool that was developed in recent years by researchers in the field of traffic engineering. The tool gives city planning offices and transportation planners an effective means of capturing traffic states. In the interest of evaluating the tool’s practicality, EBP drafted and interpreted an MFD for the city of St.Gallen. Working together with transportation planning agencies, we assessed the tool’s analytic scope and discussed potential areas of application.
Traffic in densely populated urban settings is typically characterized by an elevated demand for road-network access and a limited supply of road-network access. Many urban traffic nodes are places of congestion, especially during peak hours. While it is possible today to accurately describe road capacity and traffic states at individual traffic nodes, no effective method has been available for entire road networks. The MFD promises to do precisely this. In contrast to fundamental diagrams for individual traffic segments, the MFD takes account of dynamic interaction and compensatory mechanisms throughout the network. If a particular node is overloaded, the system may present alternative routes that are not overloaded.
Easy interpretable overview
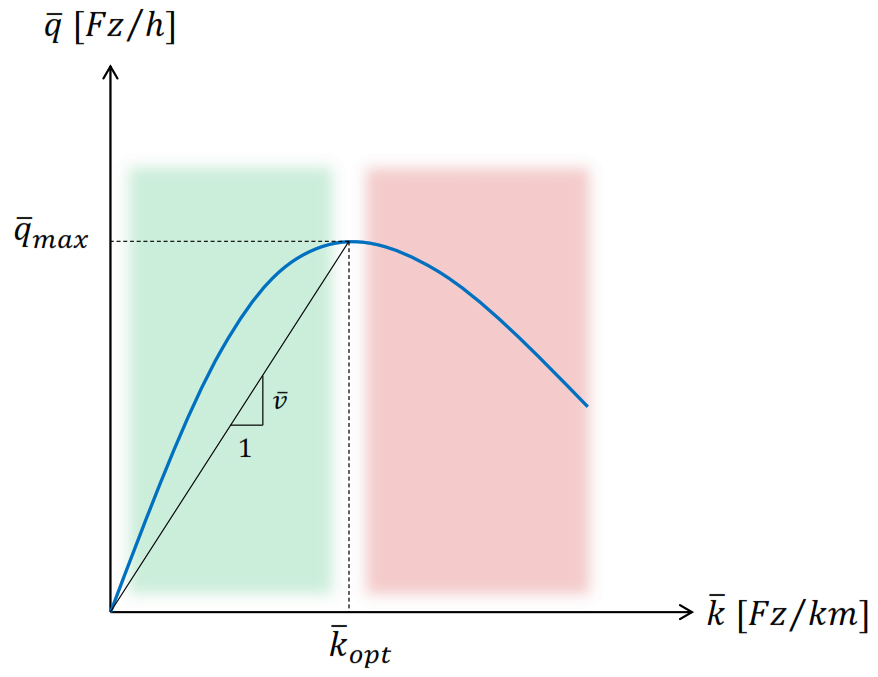
The MFD describes the relationship between the average vehicle density [v/km] and average traffic flow [v/h] in a road network within a defined perimeter. Network-specific curves (shown in blue in the diagram) can be calculated by entering traffic data for observed lane segments over an extended period of time. The resulting curve can then be used to determine whether an observed network state is stable (flowing traffic, shown in green) or unstable (congestion, shown in red).
Applying the MFD to St.Gallen
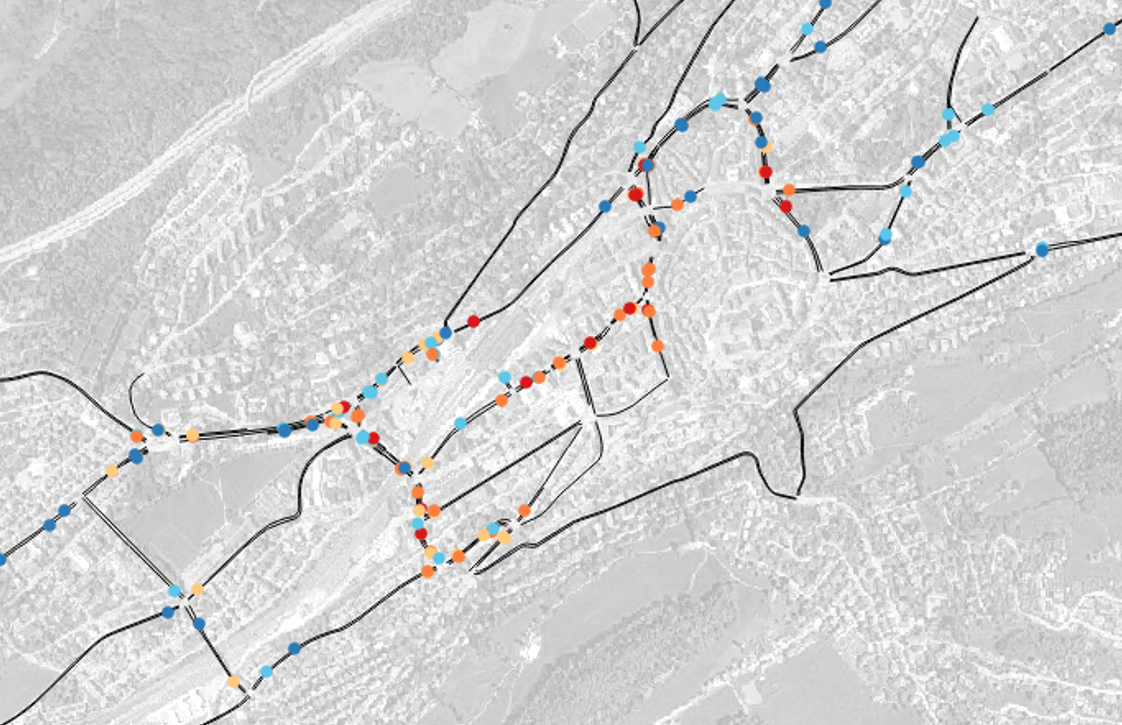
To draft an MFD on the basis of detector data, EBP first worked out an appropriate evaluation method. We then applied this to the city of St.Gallen and tested its plausibility. A number of sections of the road network in St.Gallen’s city center show an especially high probability of congestion during peak hours.
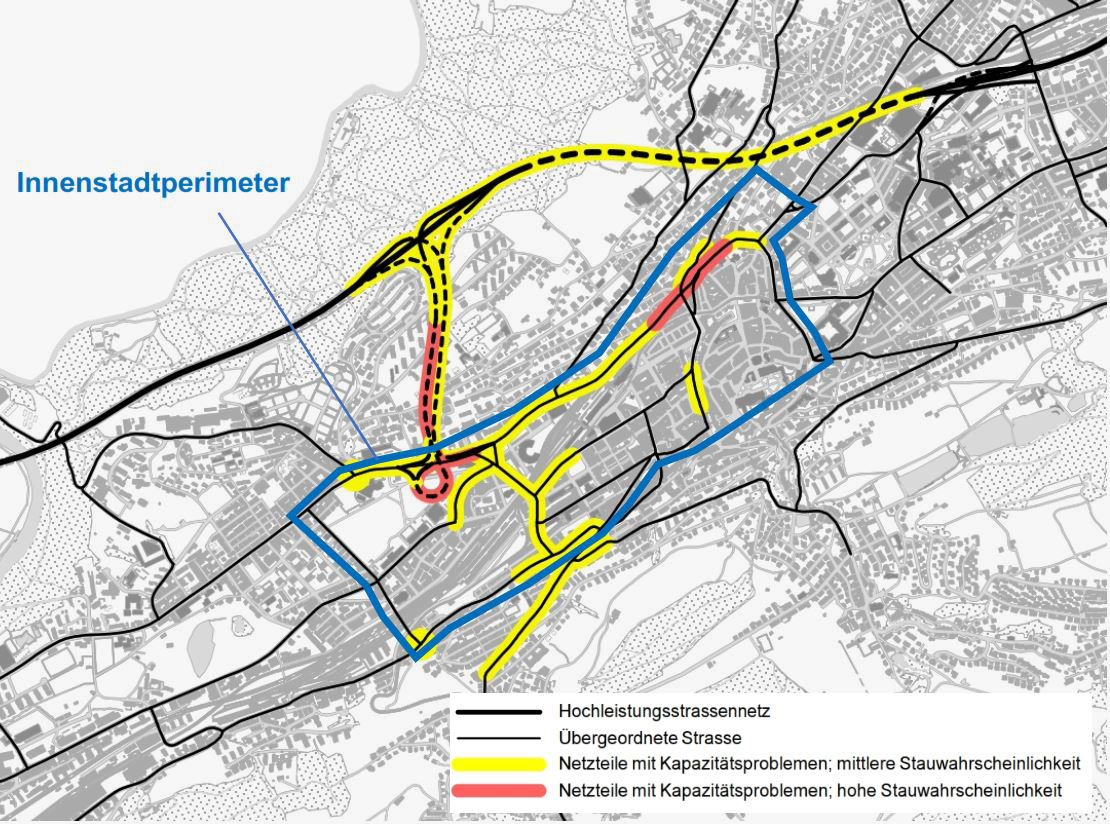
Using GIS tools, we simplified the St.Gallen road network and defined a perimeter for the city center. The perimeter encompasses an area of around 1.1 km2 and 125 lane segments. The city’s department of public works (Tiefbauamt) provided highly granular measurement data – derived from more than 270 detectors – for the month of September (2017). Our evaluation method took account of the location of the detectors in relation to the traffic nodes.
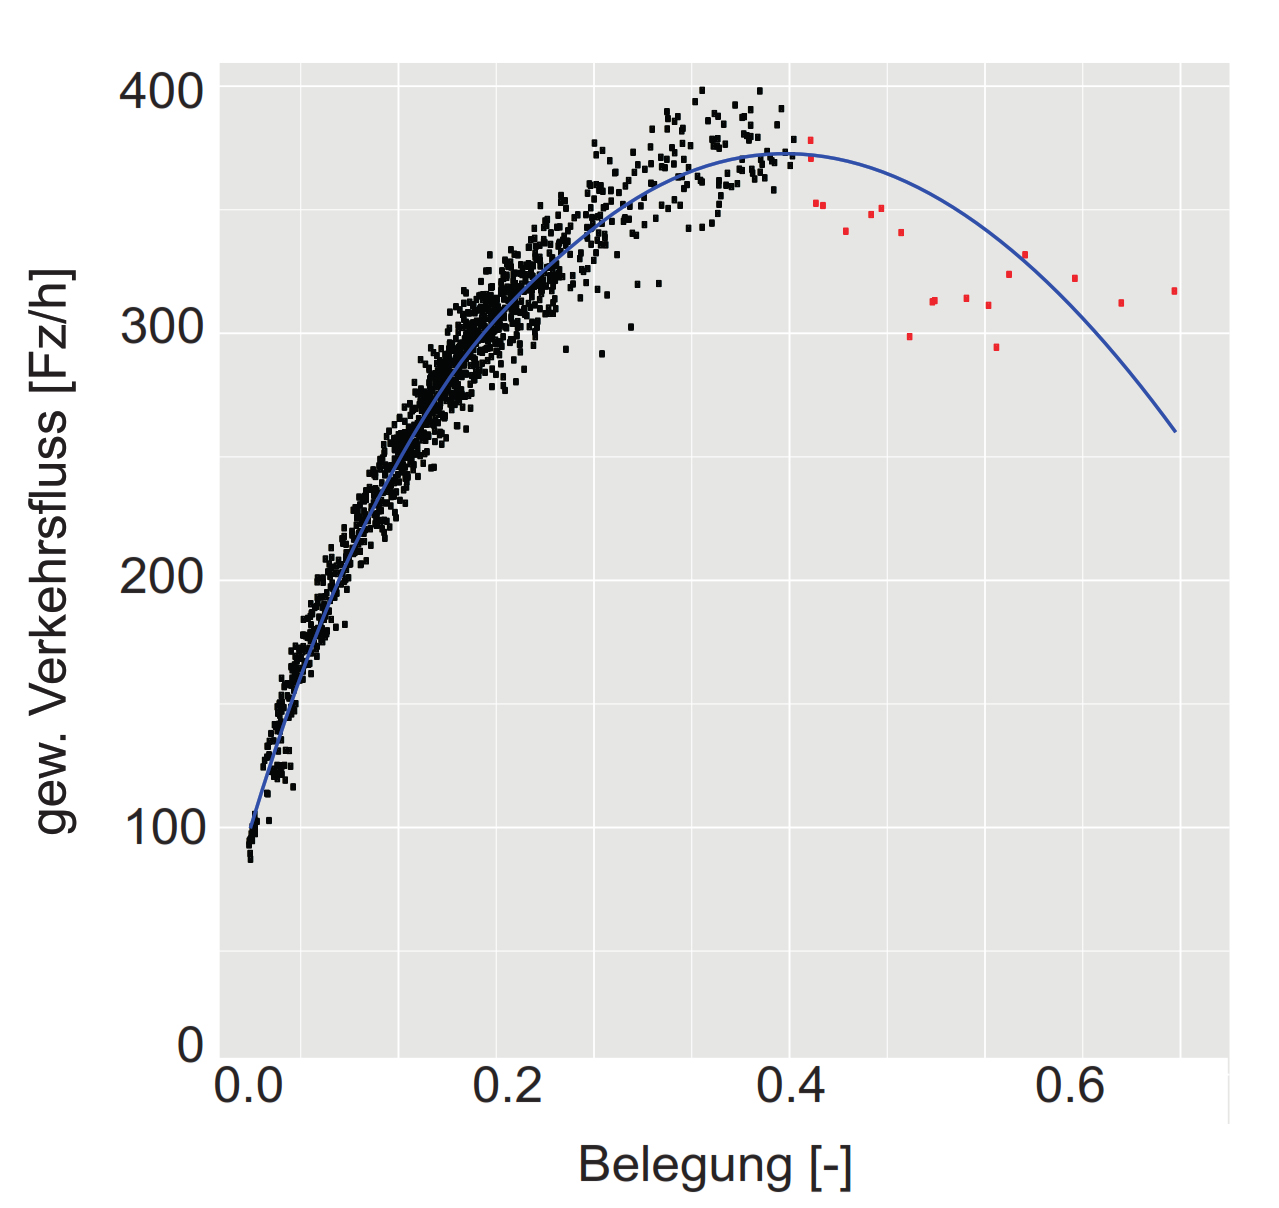
The resulting MFD is shown in the figure below. The calculated regression curve (blue) can be used to determine the maximum network capacity and the traffic states in the St.Gallen road network. Result: while traffic in St.Gallen’s city center remains stable most of the time (area in the left part of curve), unstable states (area in the right part of curve) also arise (red dots).
Many applications for various target groups
We have discussed the results of our pioneering MFD application with various city and cantonal transportation agencies. In the course of our discussions, we worked out the following promising applications:
- Monitoring of road networks for congestion states, traffic qualities, congestion hours, travel-time changes, travel speeds and mileage
- Use as an indicator in the context of prioritizing infrastructure projects
- Topological network analysis to evaluate alternative project options (simulation)
- Calibration of simulation models
- Determination of metering parameters in traffic management
The MFD offers a promising approach to examining road networks. Our trial involving drafting an MFD for the city of St.Gallen on the basis of detector data revealed the clarity of the information content. Our method enables one to conveniently generate valuable representations of traffic dynamics within a perimeter and to monitor the dynamics in real time.


